PUZZLE Platform
Here you can find instructions for the basic functionalities of PUZZLE Platform.
In short, from the user perspective, the flow that we present below can be summarized as:
Go to the Marketplace, find the desired policy and download.
Go to the User Dashboard, and select the desired application.
Go to the Policies section, then upload the download policy by selecting New Policy.
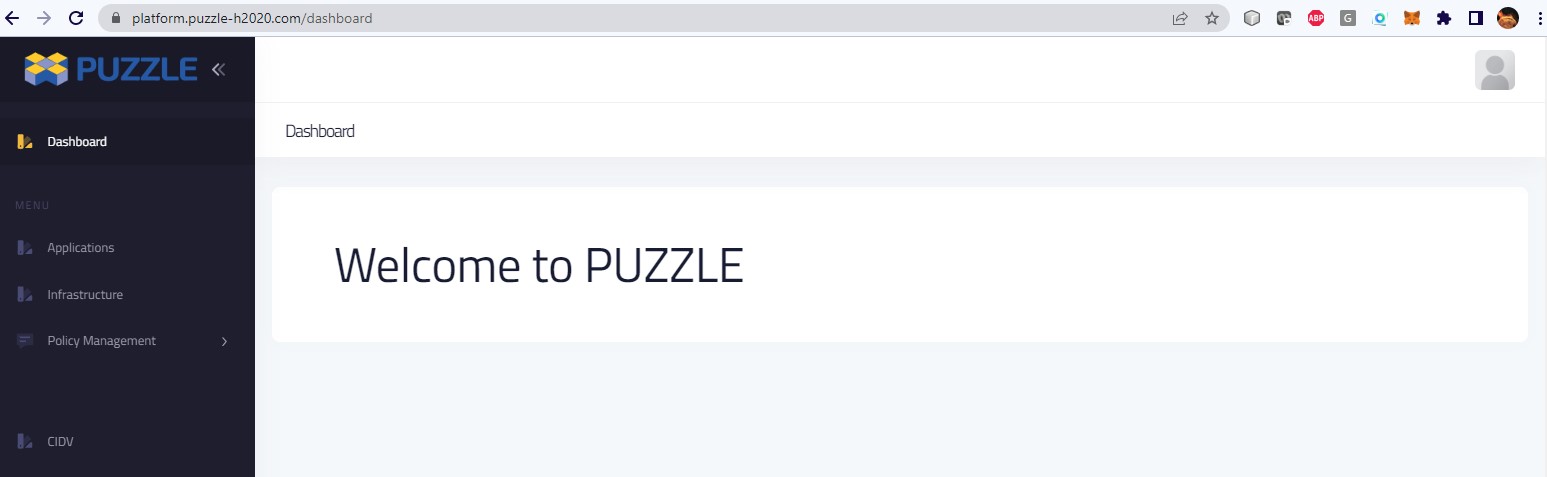
User Dashboard
In the User Dashboard landing page, the user can select among the available applications in her/his cluster.
By selecting the desired application, the user is redirected to the application’s page where she/he can find all the available information about the application. Here, the information is divided in three sections:
Login and configure cluster.
And the Policies section where the user can view, add or delete policies.
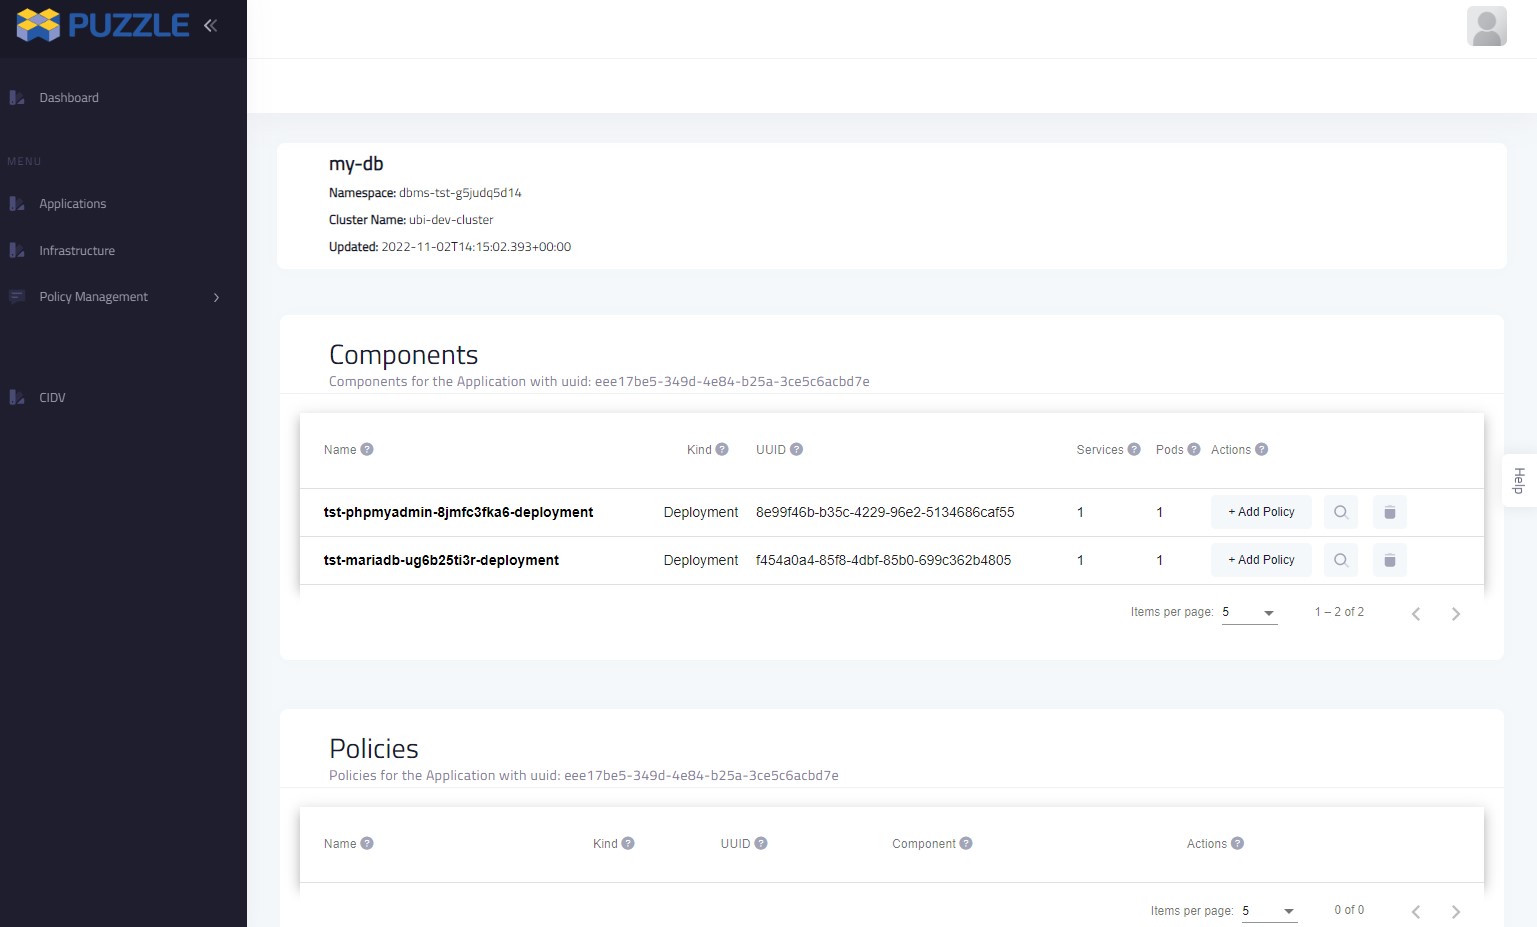
The Components Deployment section, where the components of the application and the connection between them can be found.
The Incidents Representation section, which contains all the incidents that occur in any of the components.
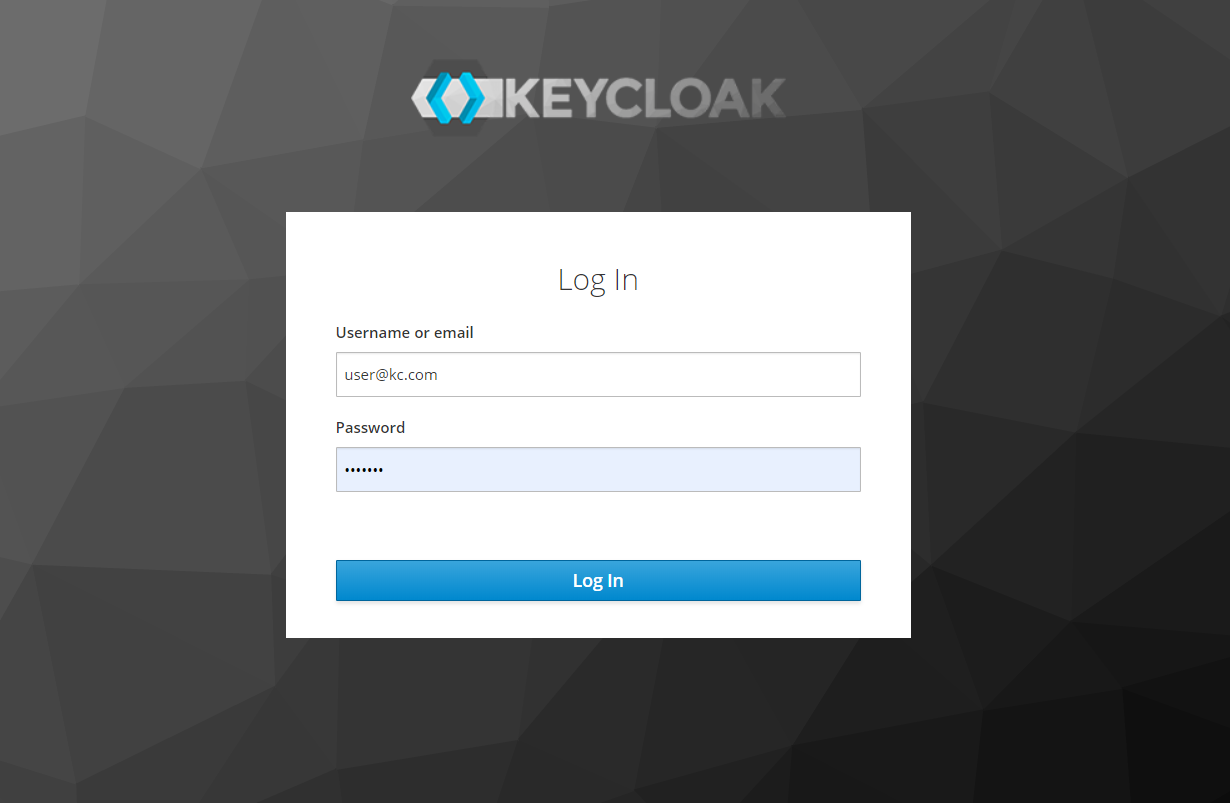
Login
When the user visits the PUZZLE Dashboard’s URL, he will be asked to insert his credentials to enter the user interface. For this purpose, the Keycloak open source platform was utilized to handle the user management and access to the Dashboard
Provide your login credentials and click the Login button.
Upon successful authentication the following screen will be presented. It provides an overview of the available use case deployments of the cybersecurity and monitoring agents. The deployments that each user can access will be specific to his role and organization.
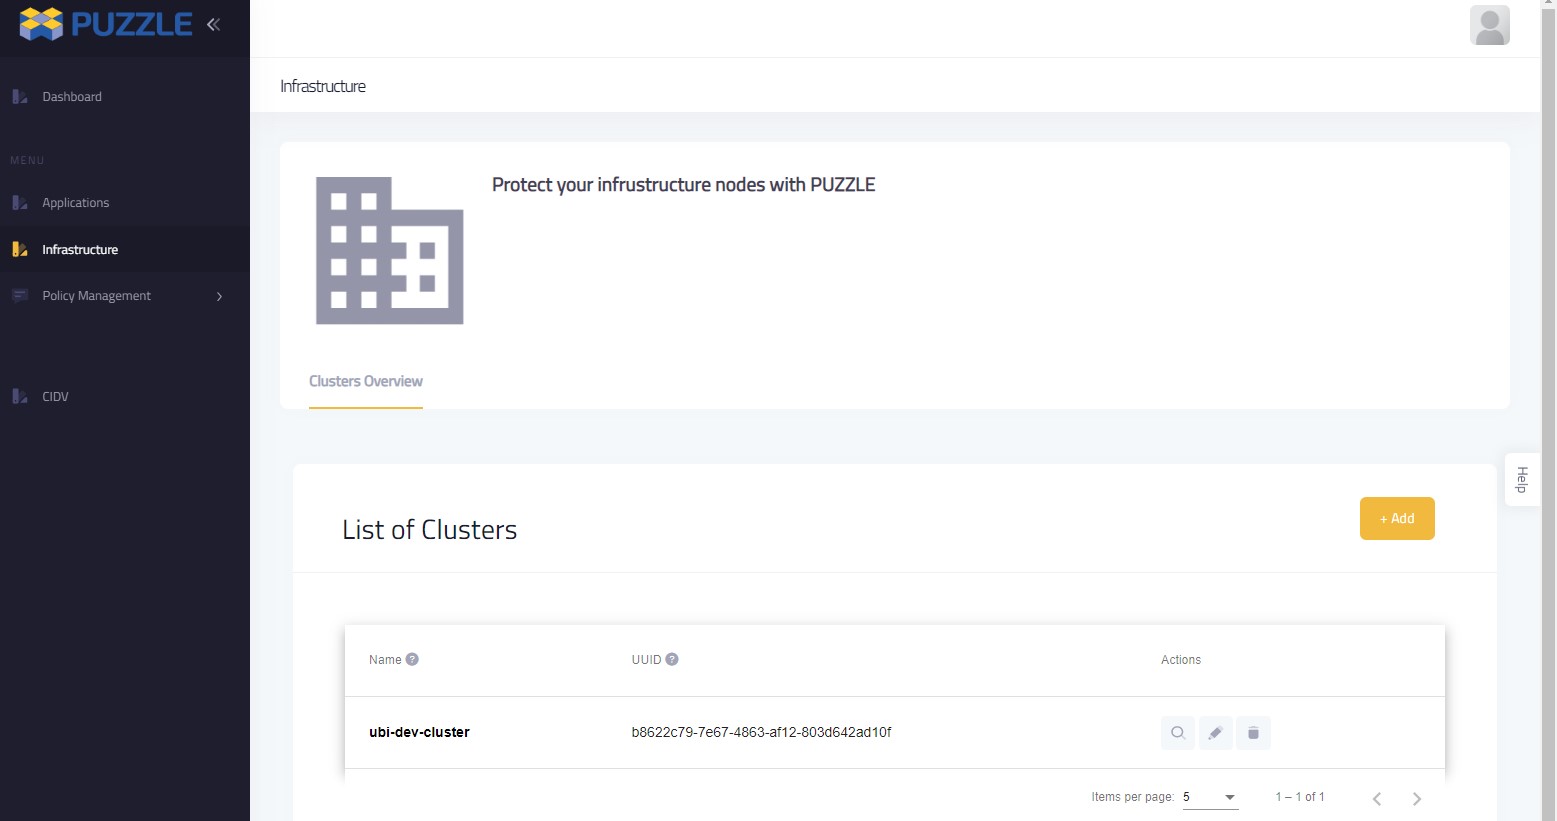
Infrustructure Setup
The first step for a user is to add her/his infrastructure.
To do so we press the Infrastructure link from the main menu on the left.
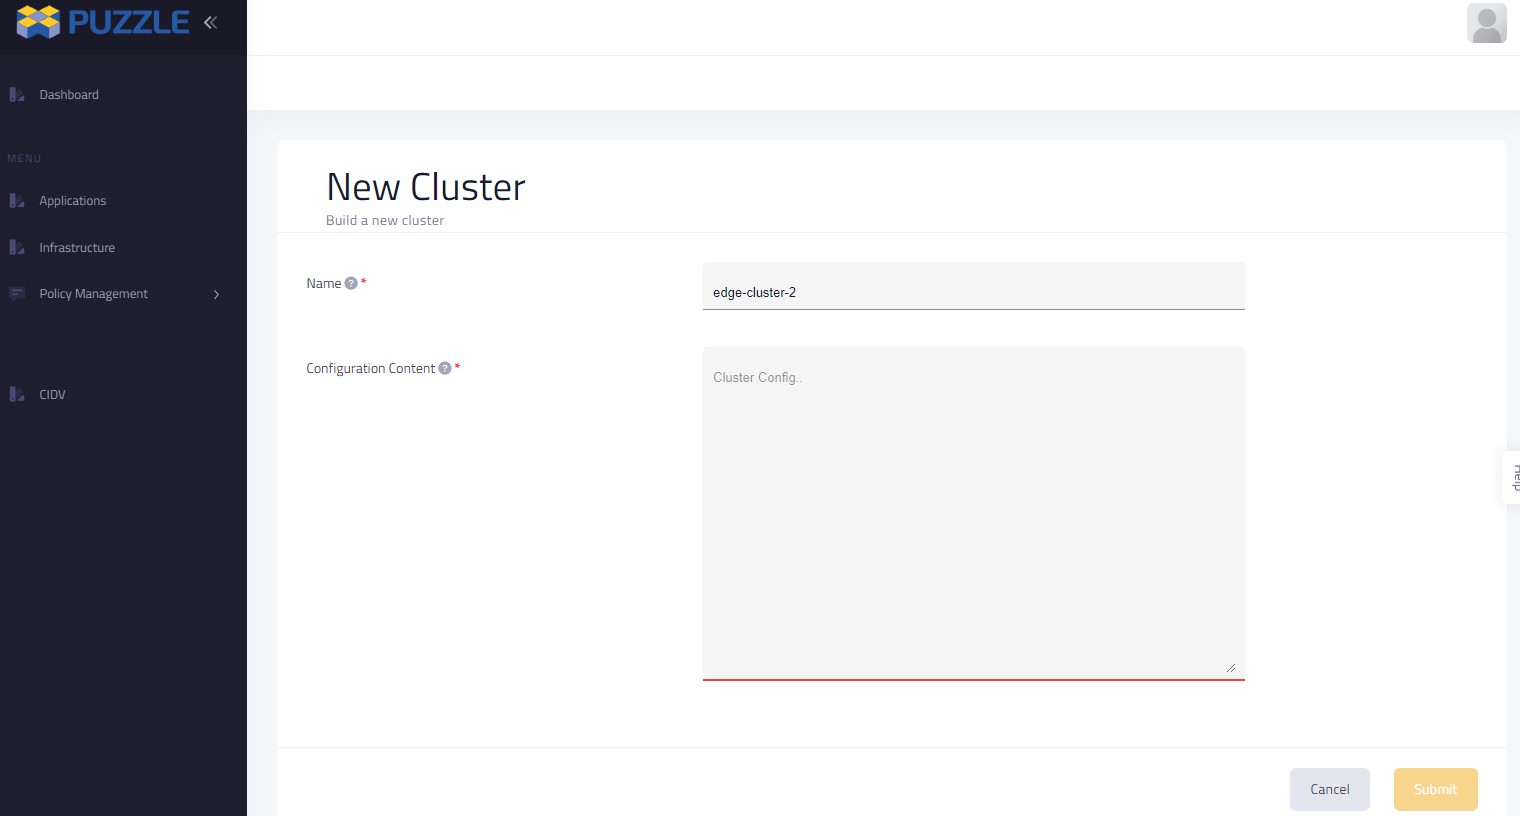
And then we press the Add button in the form that appears we fill up the fields.
Name, with a desired name for our cluster and Configuration Content with the contents of the kube-config file from the kubernetes cluster…
And we press the Submit button.
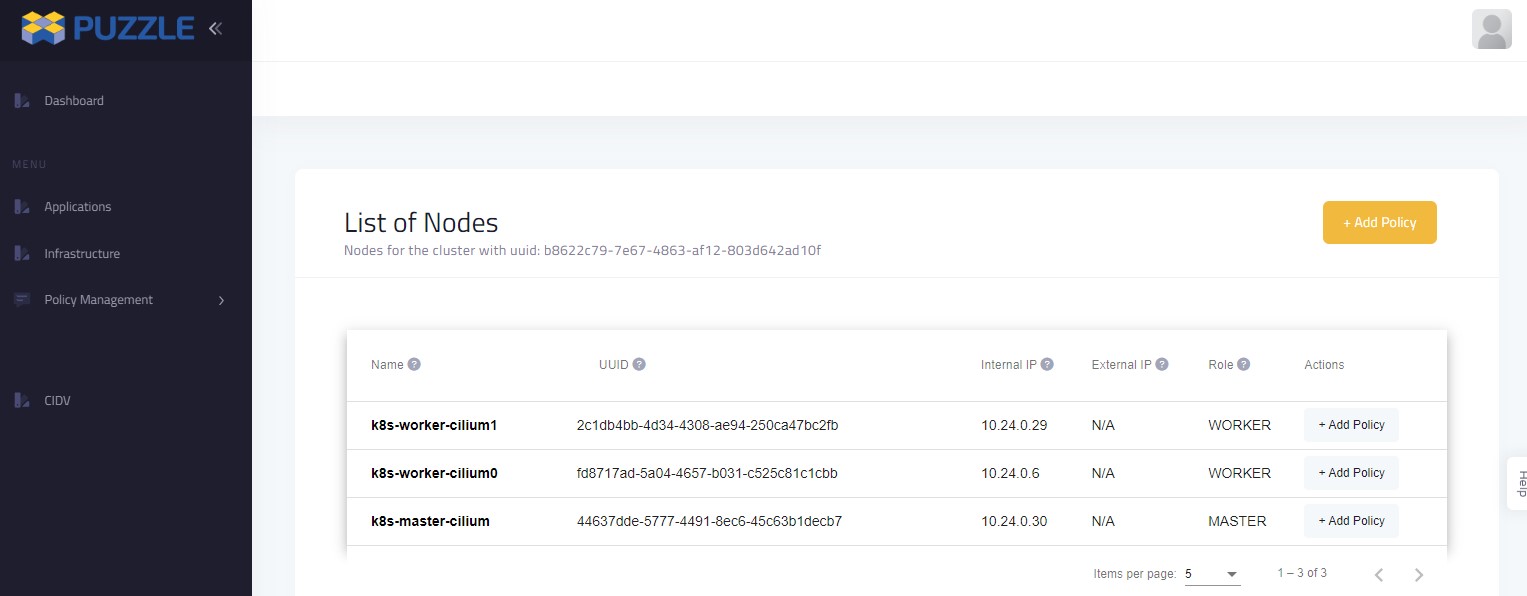
In the next page we can see, in the List of Clusters table, the cluster that we just added.
By pressing the View button, we can view all the available information, such as the list of workers and their role in the cluster.
You can also see the relevant video
Policy Management
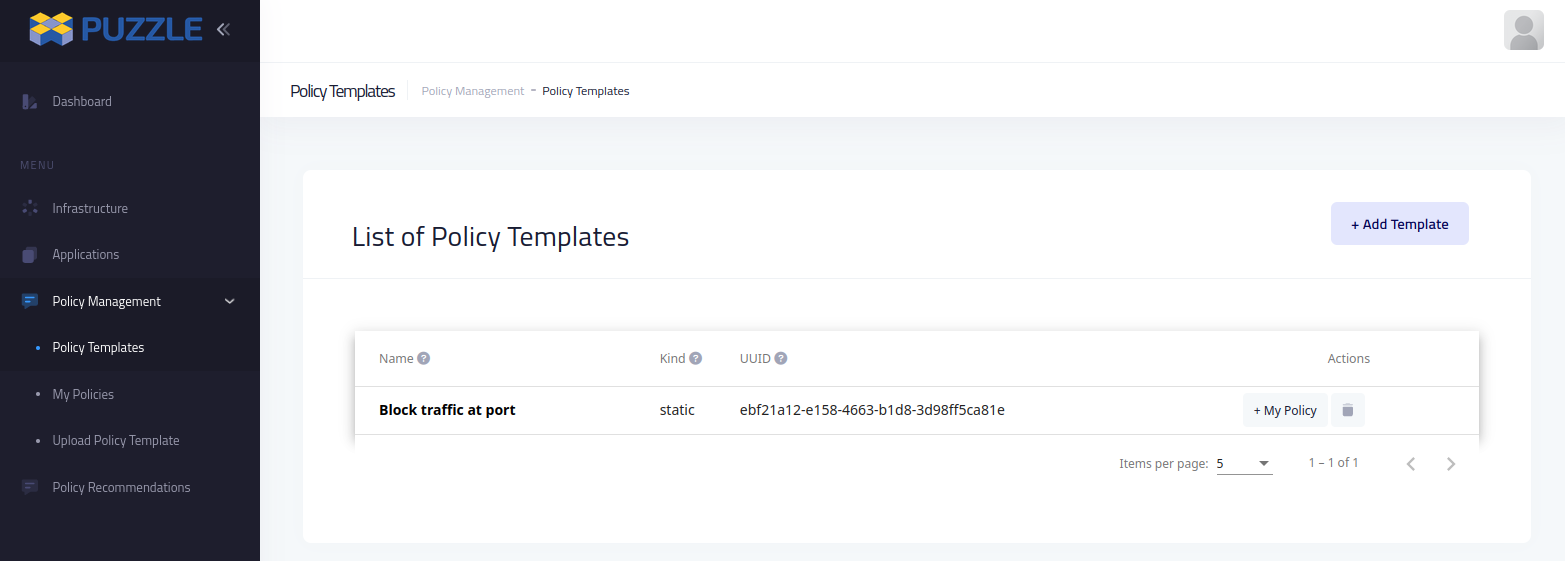
Policy Templates
Policy templates (downloaded from Marketplace) can be configured and used in the dashboard.
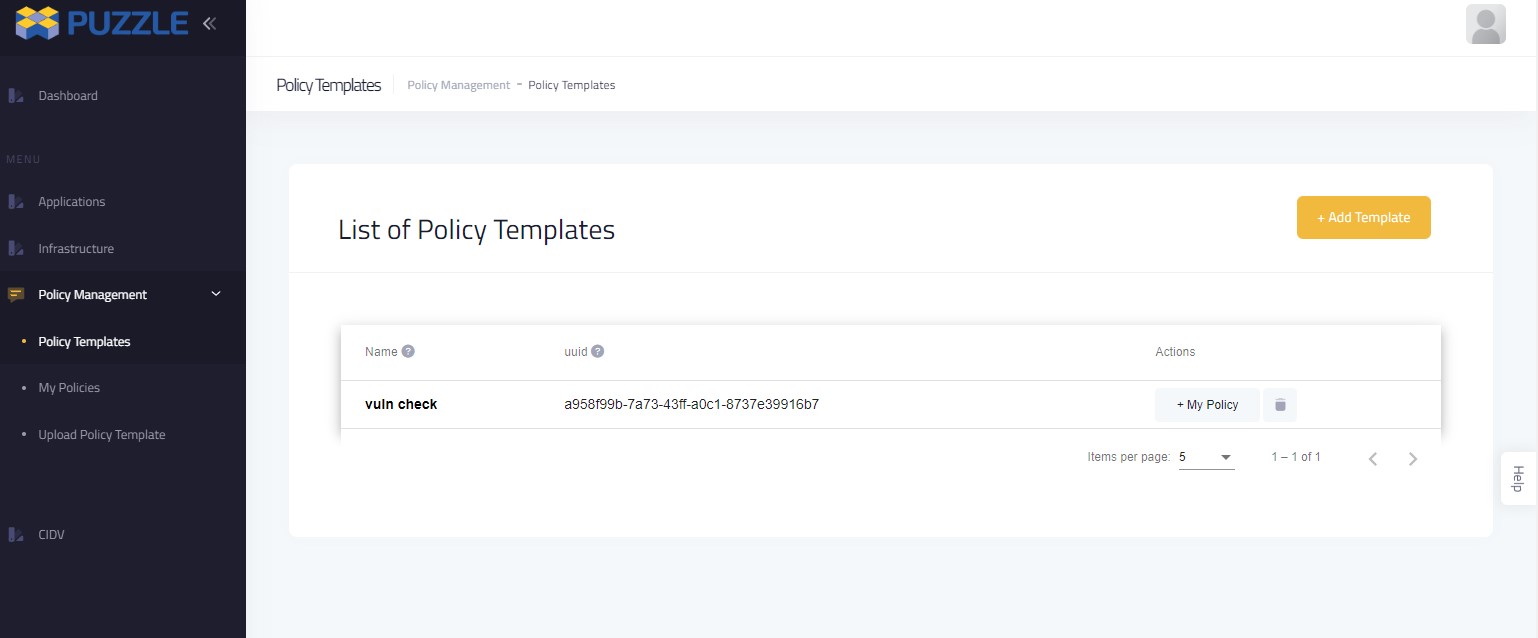
Policy templates can be directly provided by the marketplace, or can be downloaded and manually transferred.
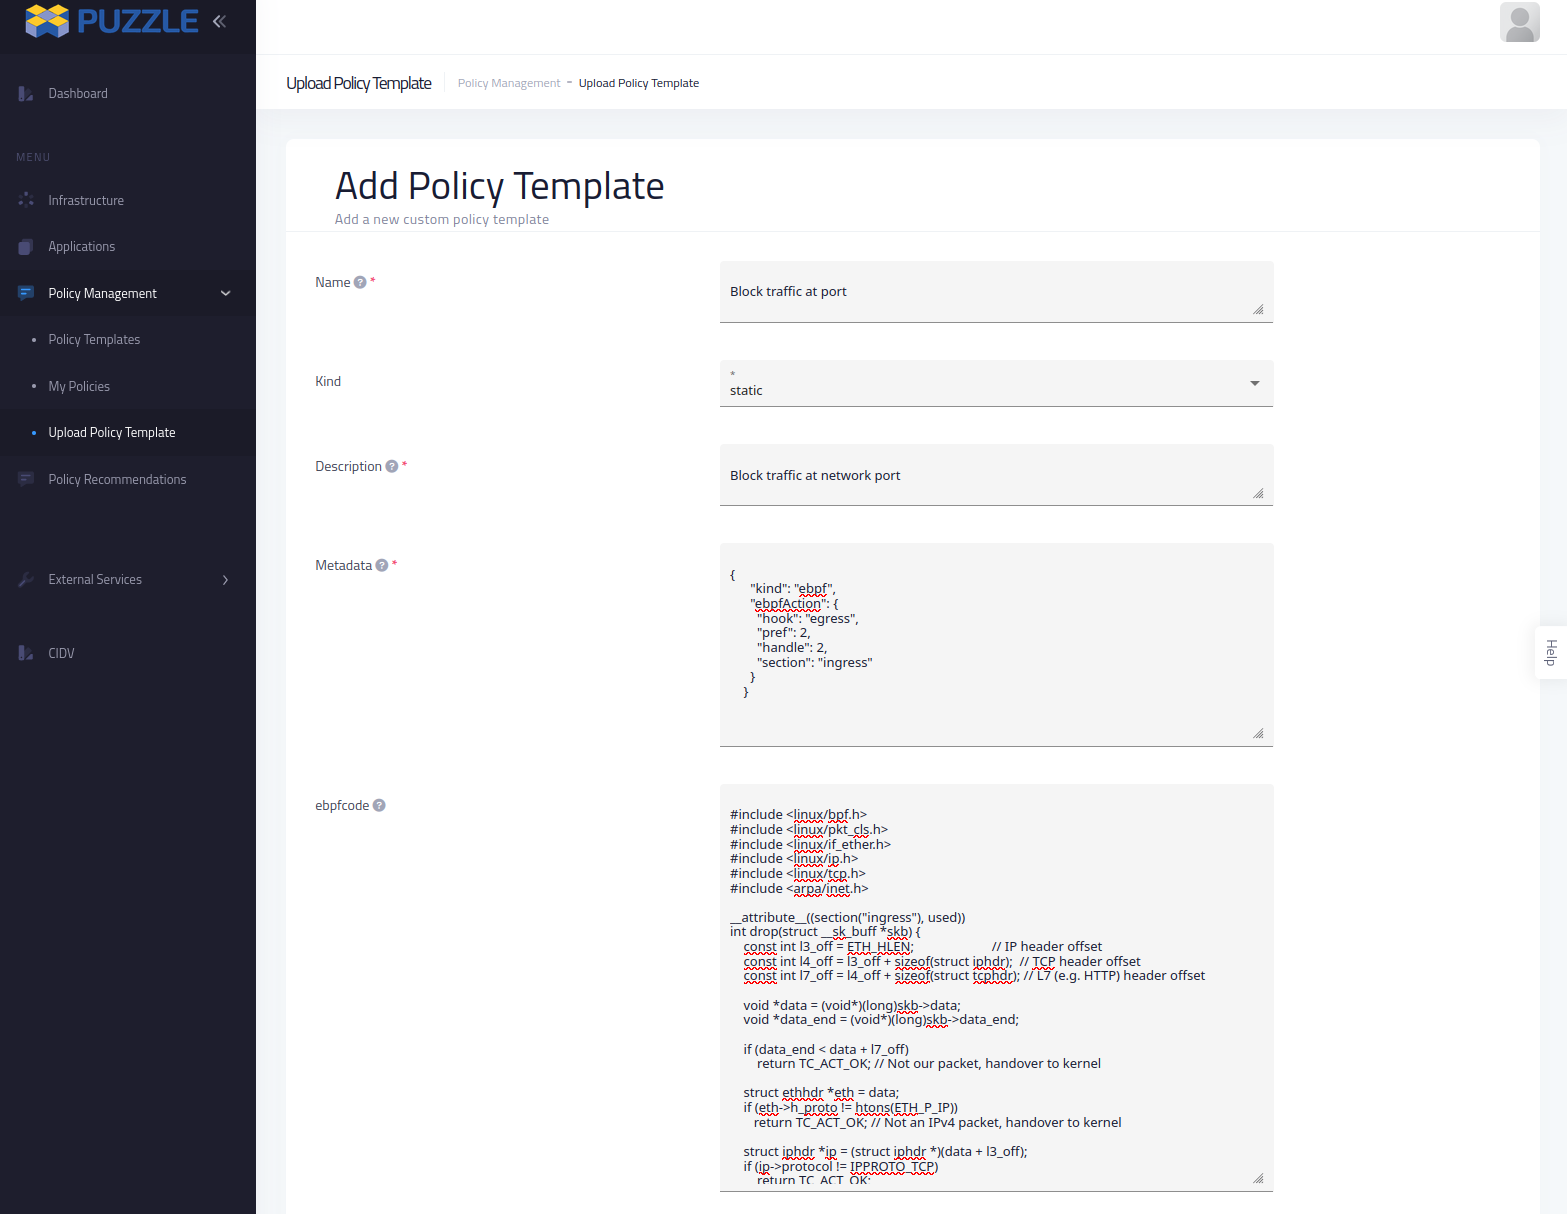
Policies template can be found in the Policy Template page
Applications
Application Setup
Then we press the Add button.
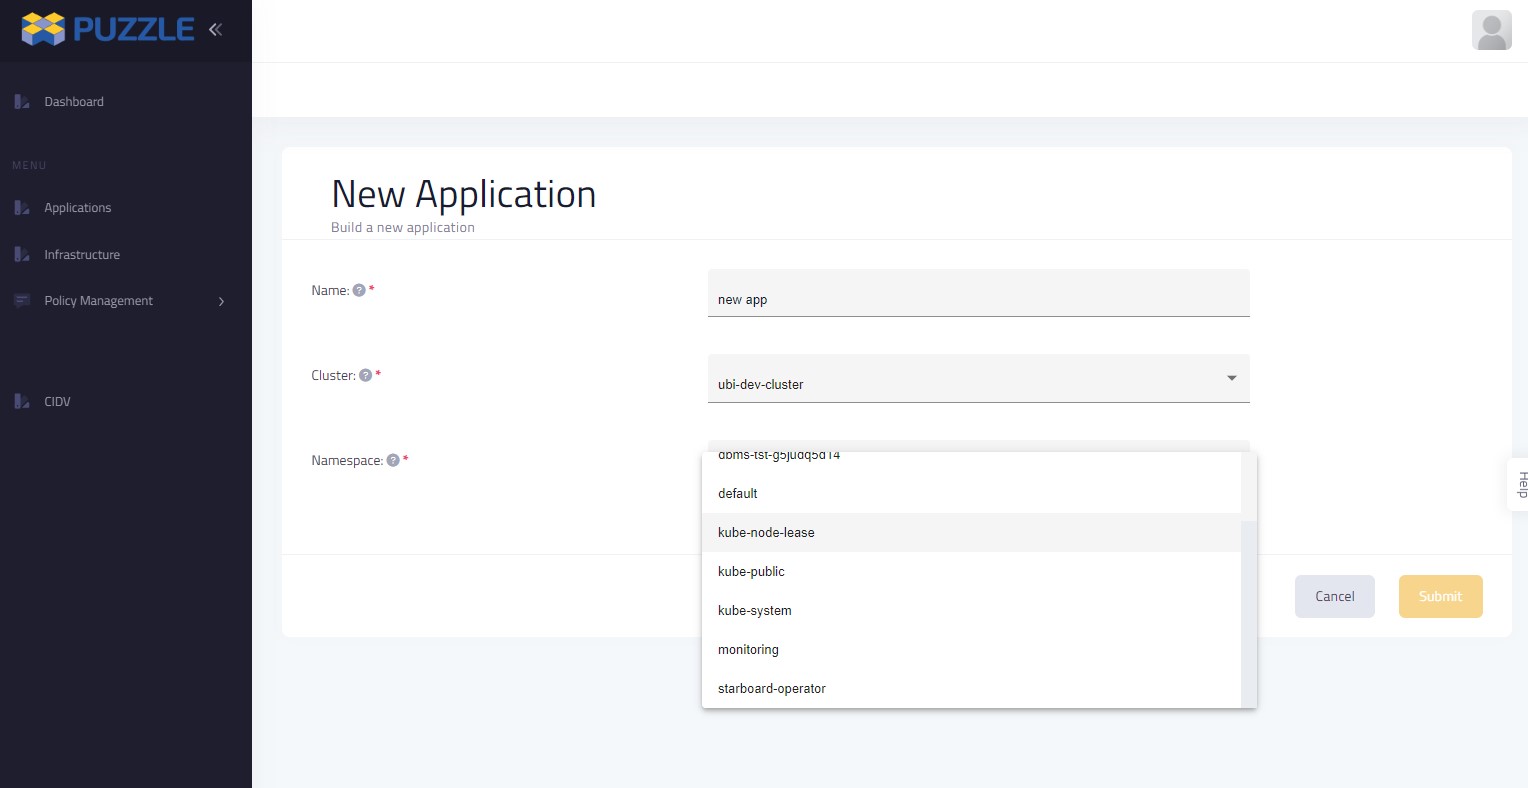
We fill up the fields on the form that displays:
Name, with a desired name for our applicatio.
Cluster, by selecting from a list of Clusters that we have created on the Infrastructures.
And Namespace, by selecting from a list of Namespaces that are available in the Cluster that we select on the previous step.
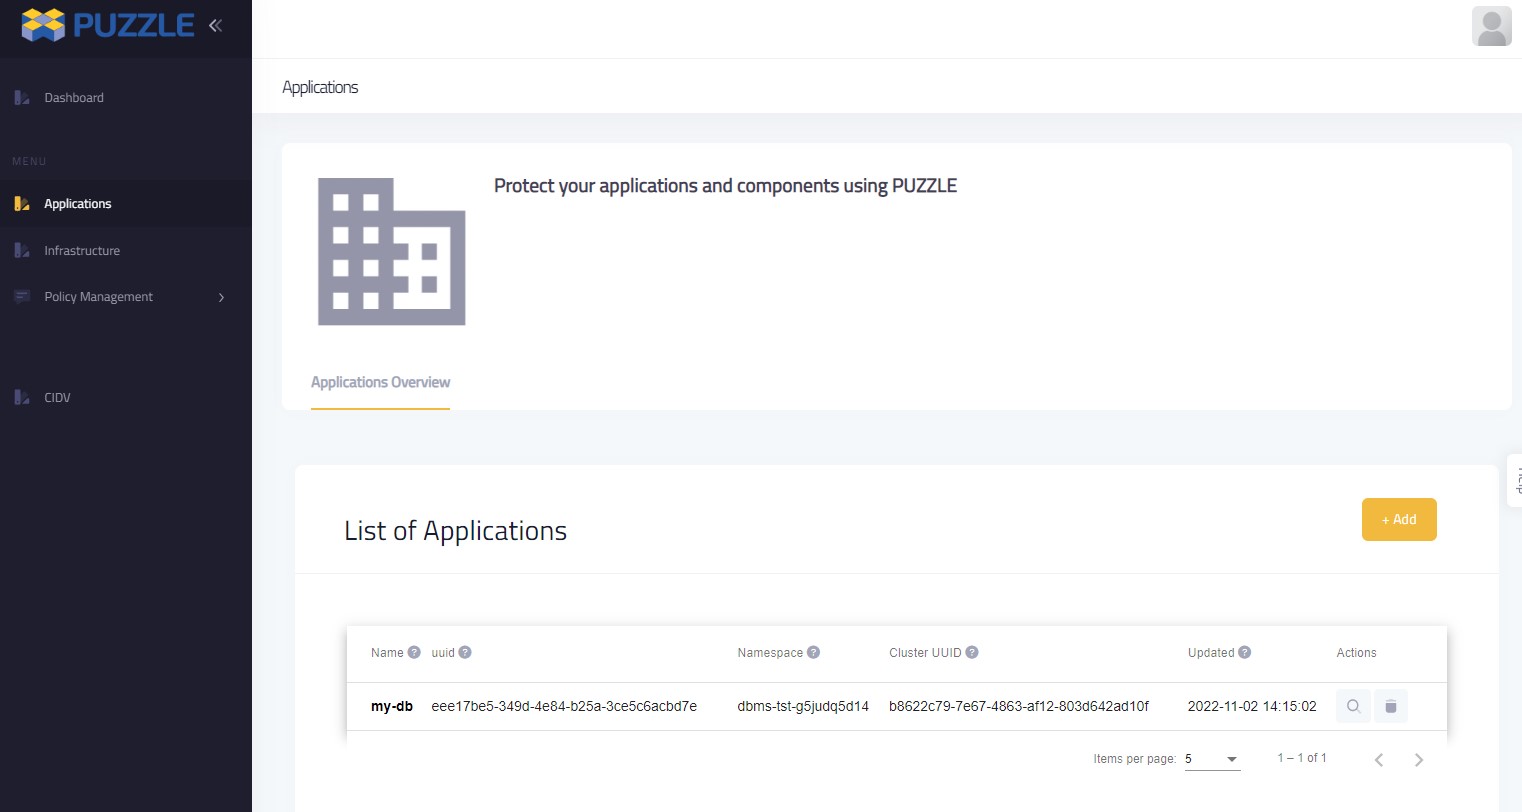
By clicking on the Submit button we transferred to a page where we can find the application that we just added in the List of Applications table.
There we can press the View button in order to see all the available information for that application, such as the list of the components and their kind.
You can also see the relevant video:
Protect Application
To add policies to components we press the Applications link from the main menu on the left - There we press the View button on the application that we choose.
In the desired component from the Components table we press the Add Policy button.
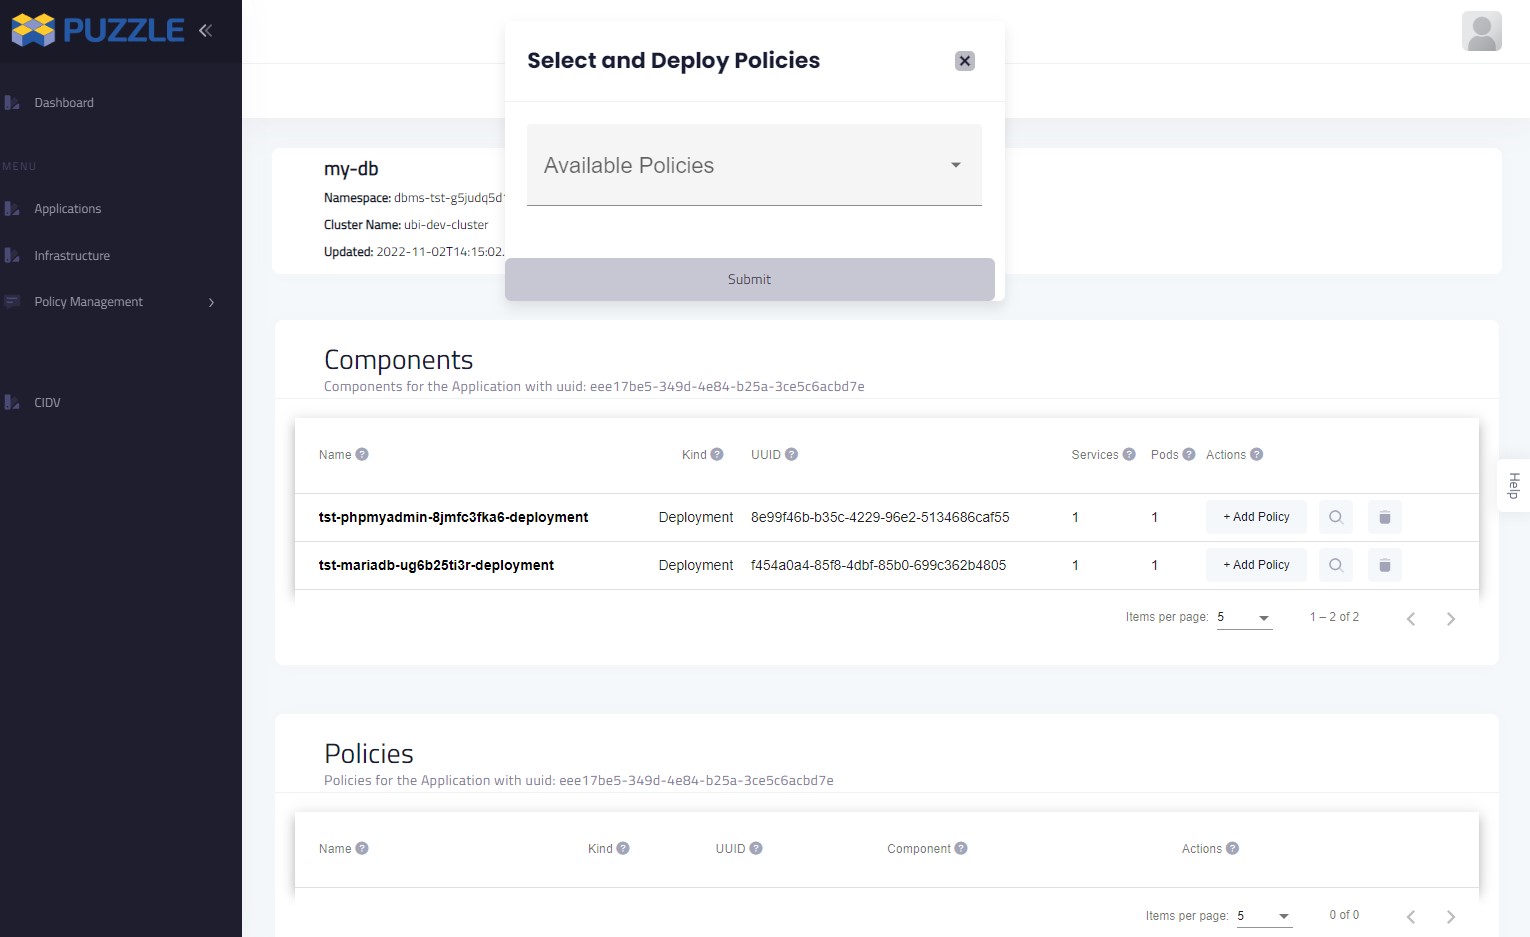
From the list of the Available Policies we select the desired policy and we press the Submit button.
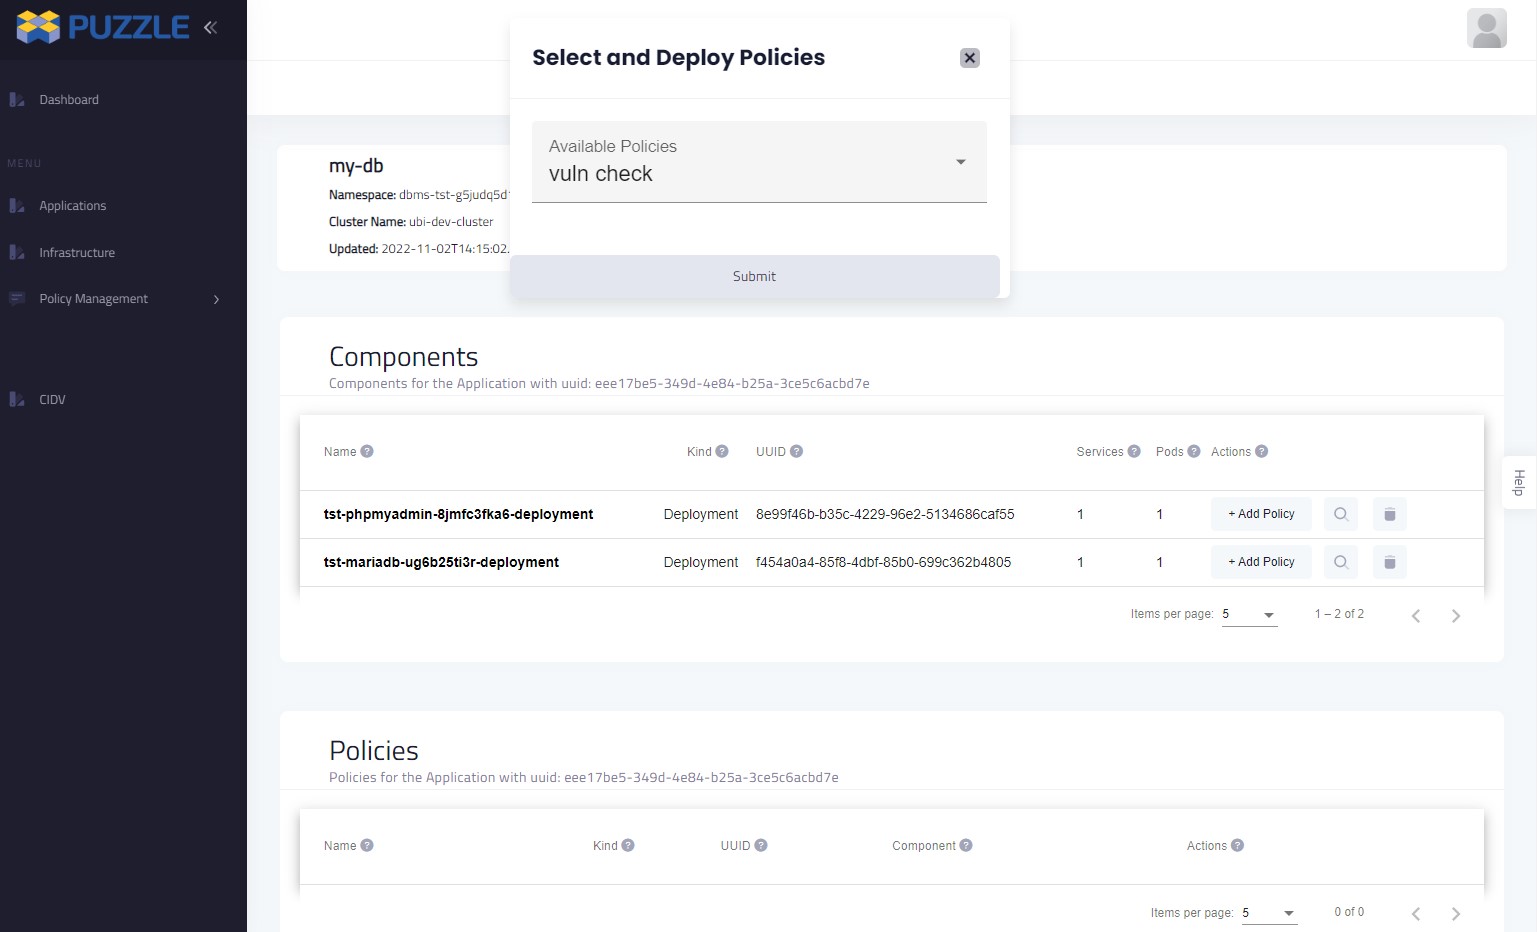
After a while we can see the selected Policy on the Policies table.
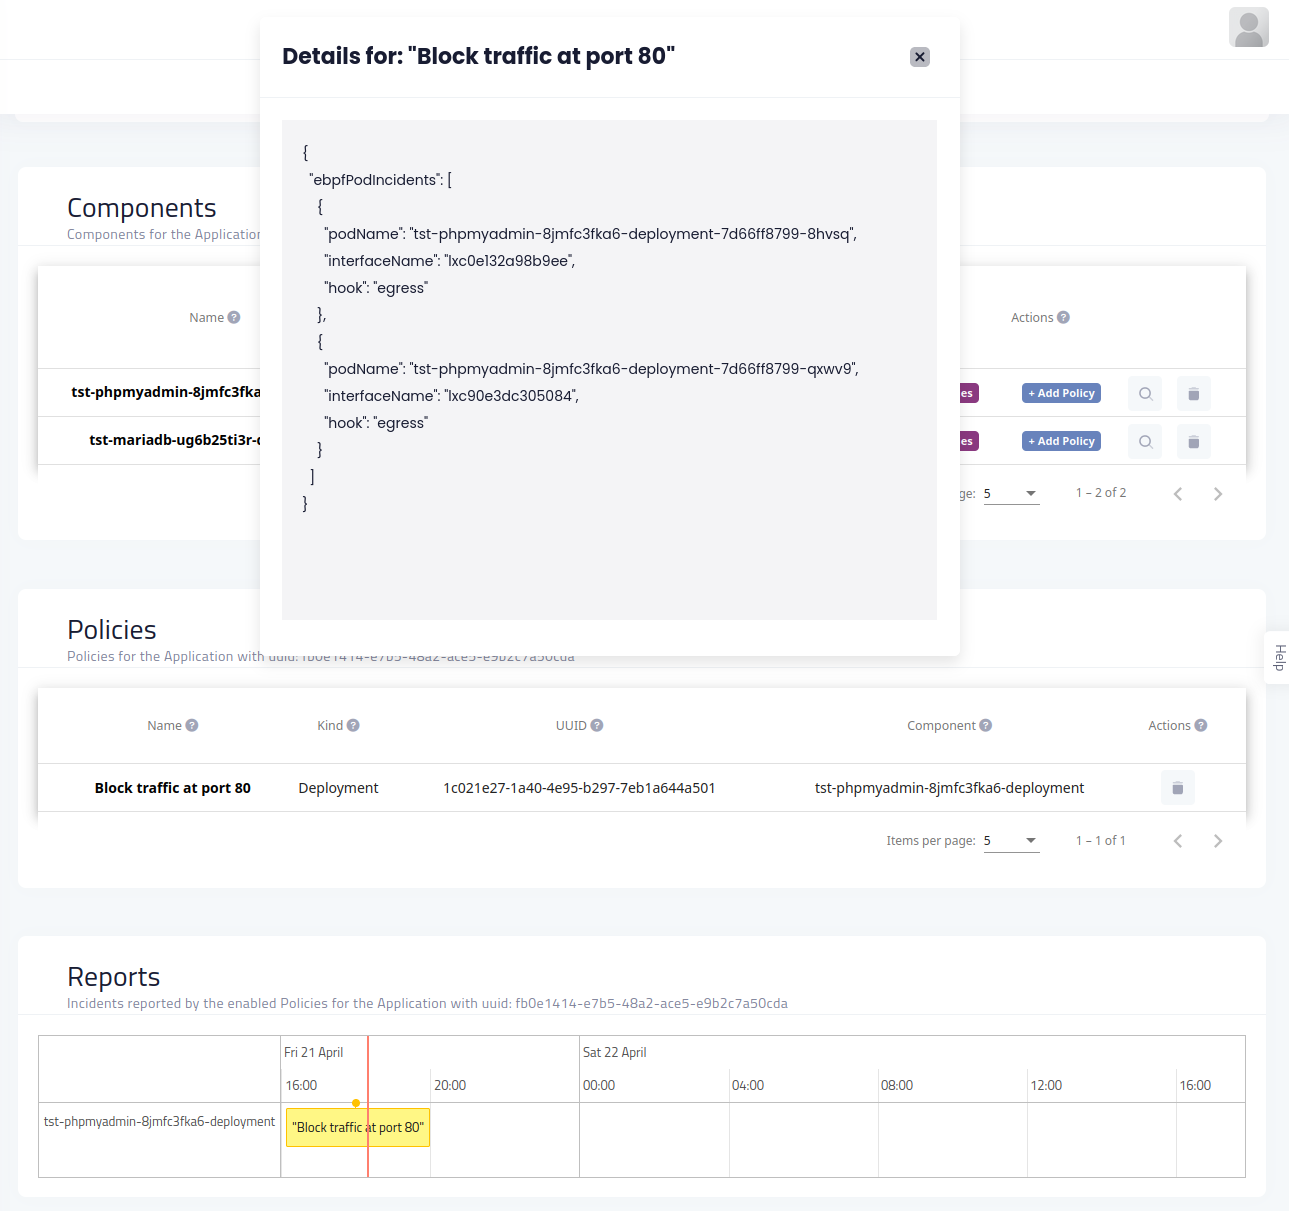
When a policy meets the criteria we can see the corresponding report on the Reports table.
There we can see the exact time when the policy fired and by clicking on the event we can view the policy’s metadata.
You can also see the relevant video
Risk Analysis
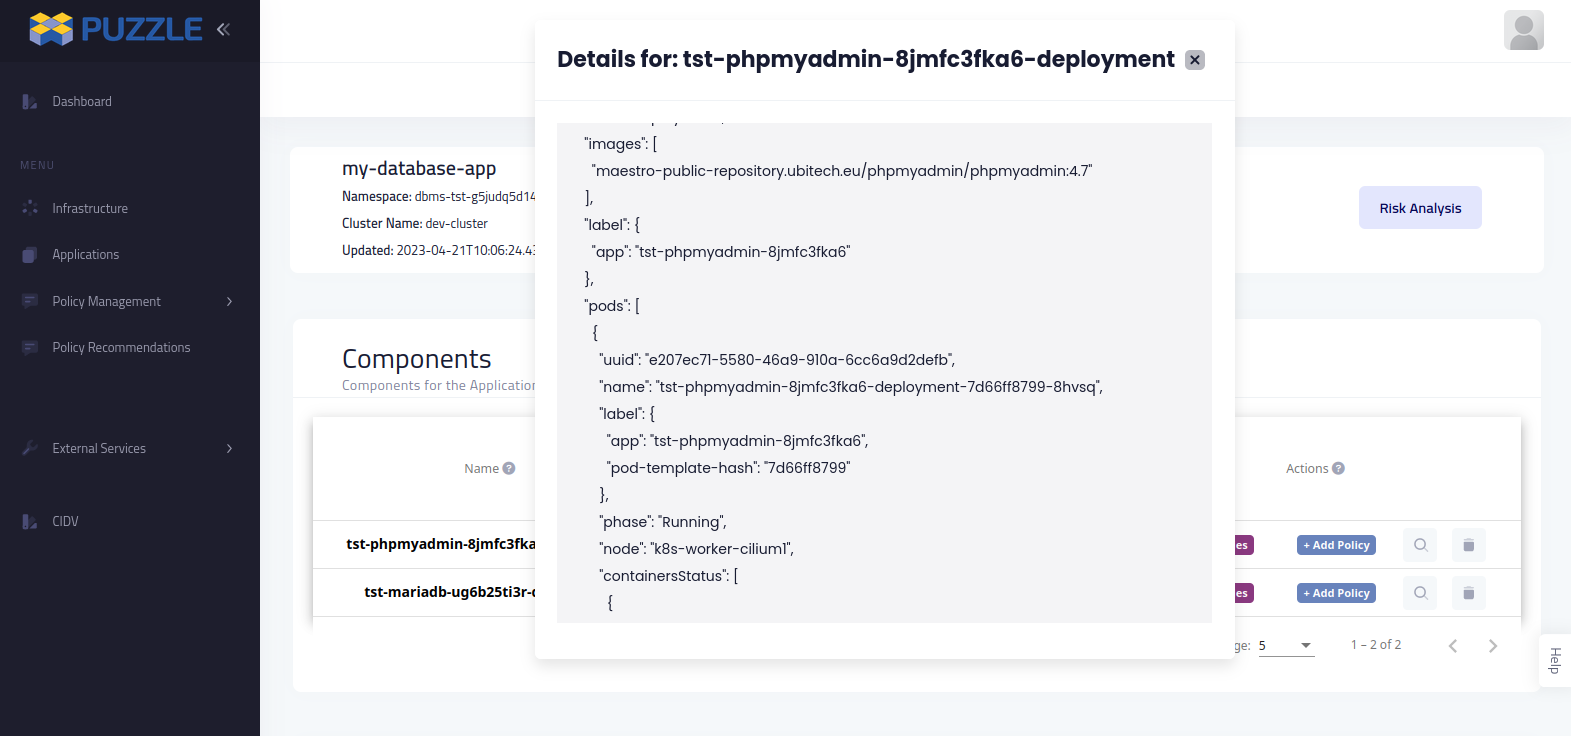
When a new application is added PUZZLE platform can automatically discover all the components and communicate that information with the PUZZLE Risk Assessment Engine which returns a report with all the known vulnerabilities about a component.
By pressing Vulnerabilities button in the relevant component the user goes to the corresponding page.
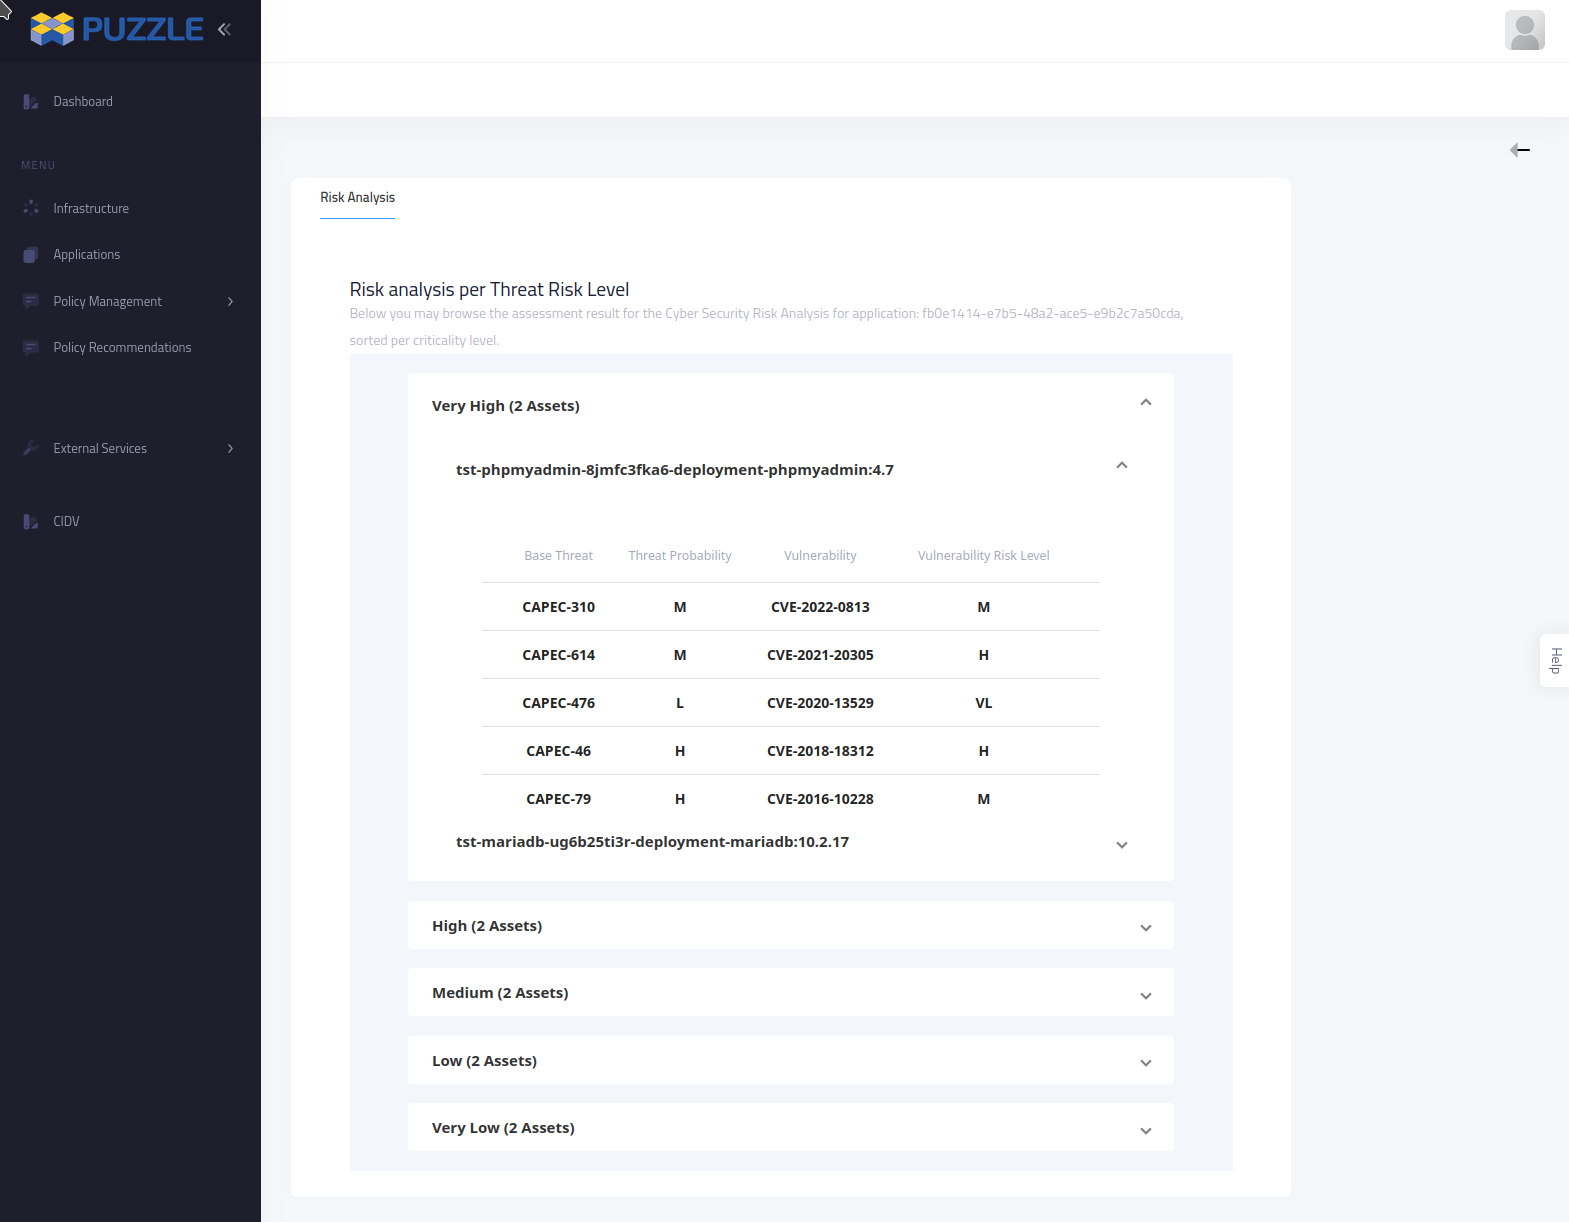
Inn the Application page the can be found the Risk Analysis button which leads to a page that contains the Risk Analysis for the application.
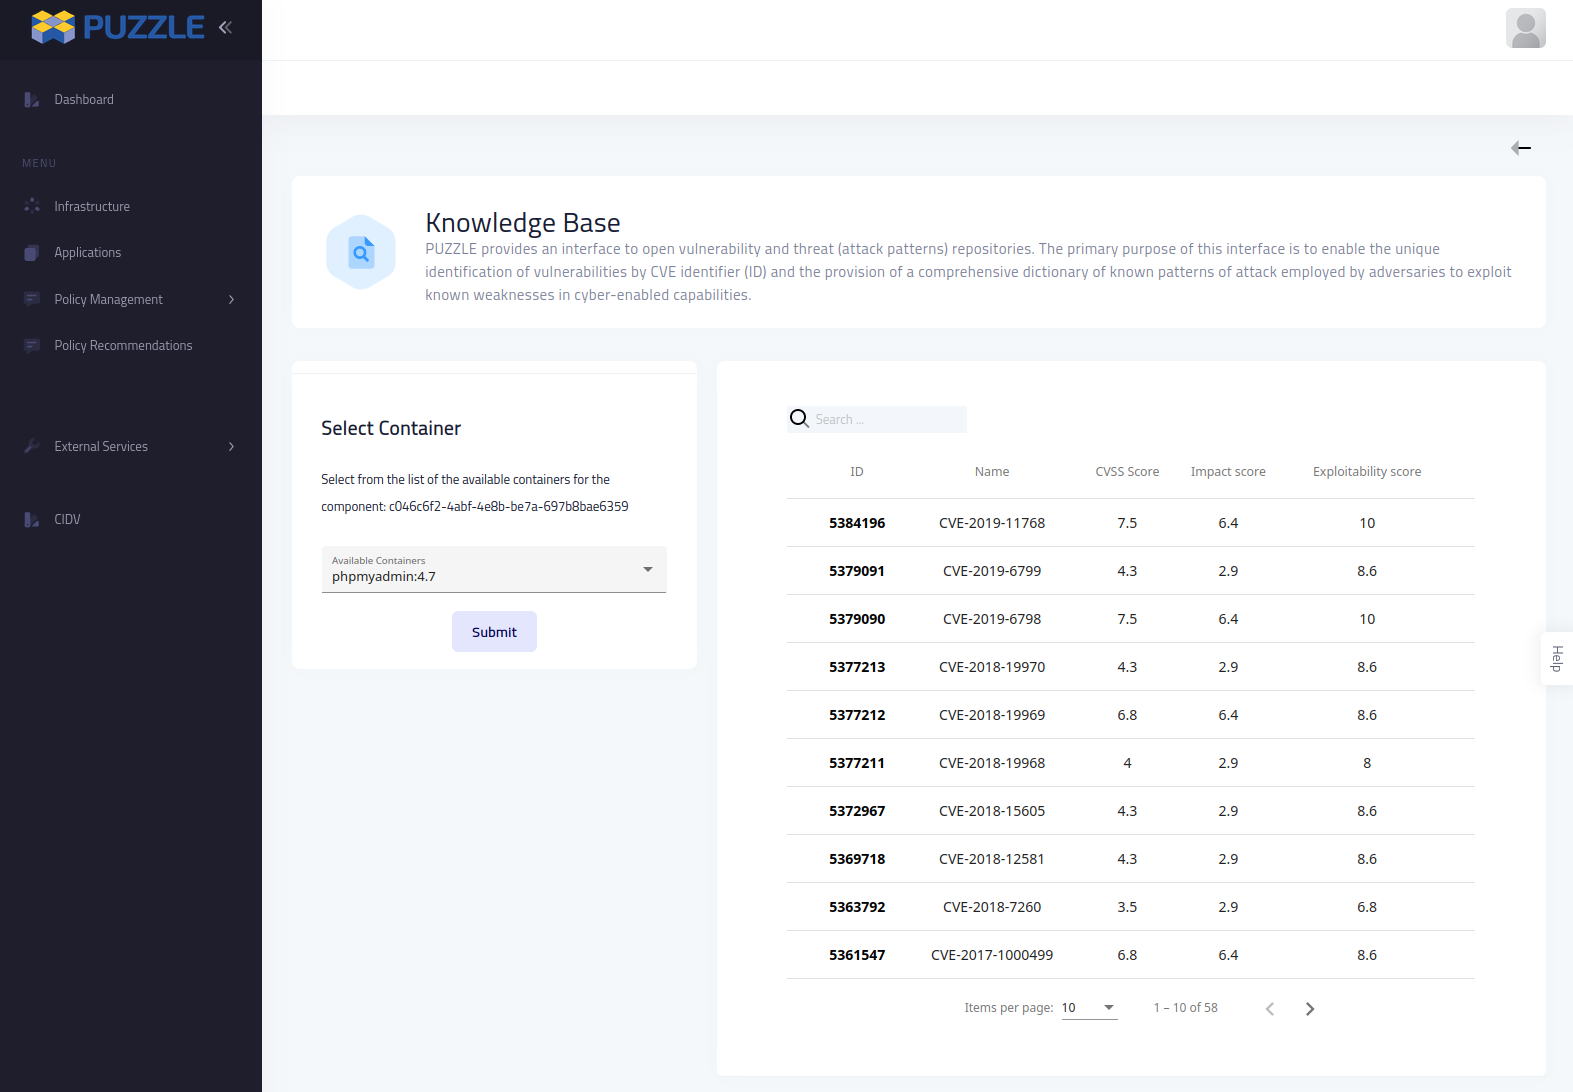
The Risk Analysis page contains information about the threats that each component (asset) faces combined with the vulnerabilities divided into categories from very high to very low risk
Reporting
The Reports are shown in a table that contains the timestamp when the report is generated and the name of the policy and are grouped by the components in which the policies are applied. Also, by pressing in the report event the users can find extra metadata about the specific report.
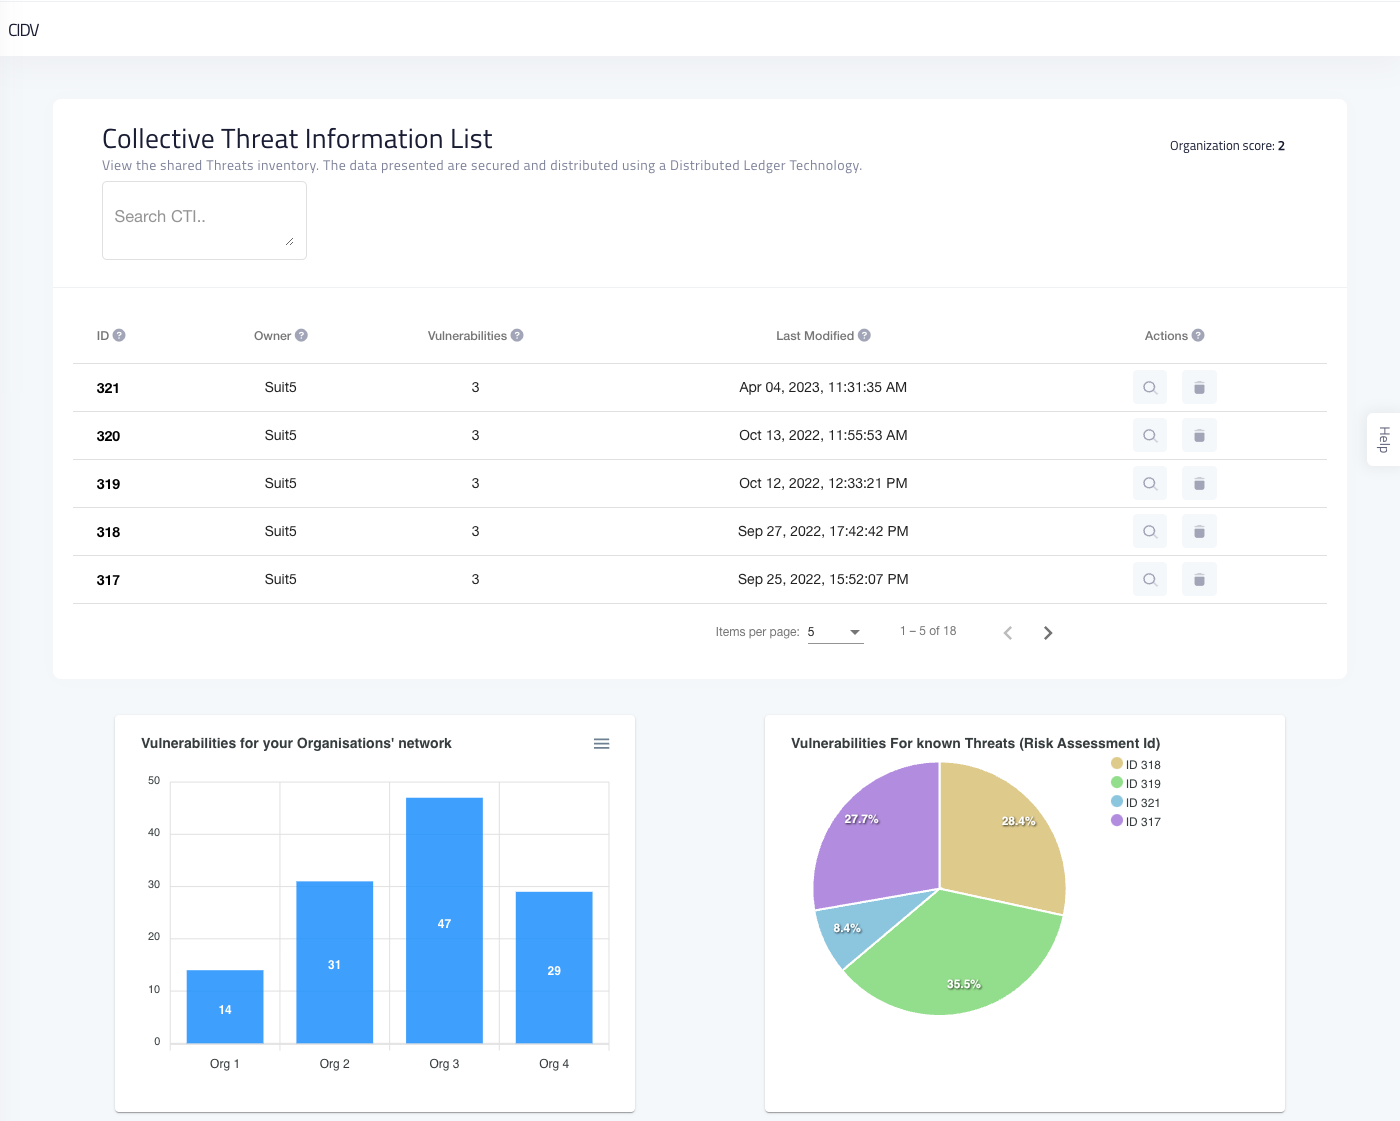
Threat Intelligence
User can share content securely through CIDV

A video showing the usage of marketplace is available in the project’s repository
With the use of the CIDV, users can monitor available threat information displayed in a table, allowing for keyword searches. There’s an option to open and examine a specific threat in its native data format, as well as an option to delete particular threats. The dashboard features complementary widgets that offer a comprehensive overview of the data stored in the blockchain network. A bar chart provides a snapshot of the vulnerabilities for each organization in the network, and a pie chart displays the number of vulnerabilities associated with each threat. These widgets collectively aid in drawing insights and facilitating deeper investigation into specific incidents by examining the raw data. Additionally, there’s a feature to download the visual representations as images.